Dynamics NAV 2013 introduced a new debugger to replace the old and worn-out debugger in the classic client. The classic debugger in Dynamics NAV 2009 did not support the RoleTailored Client and that caused a lot of swearing and a lot of work-around.
The new debugger has some new functionality that has been on the wish list for many years:
- Watching variables in all levels of the call-stack
- Debugging NAS’es
- Debugging client sessions
- Avoiding the annoying Caption Class translation in Codeunit 1
- Creating conditional breakpoints
- Everything is coded in C/AL, which means that it is possible to change the existing functionality and to add extra functionality.
Enabling/Disabling the Debugger
First of all the debugger is no longer connected to the classic client or the development environment. It is connected to a session. A session can be:
- RoleTailored Clients
- Web Clients
- Tablet Clients (Only Dynamics NAV 2015)
- NAS Services
- Web Services
- oData Services
This means that it is possible to debug any of the above. In the settings of each session, it is also possible to prevent debugging of a session.
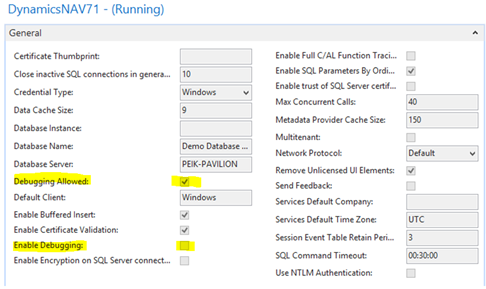
Two settings seem to affect the debugger:
Debugging Allowed: If the field is not selected, it is not possible to debug the session.
Enable Debugging: When the client first connects, all C# files for the application are generated. It has therefore nothing to do with the debugger we are going to work with.
To prevent debugging in the live environment, it is recommendable to keep the Debugging Allowed clear in all live sessions and create special sessions for debugging purposes.
Starting the Debugger
There are three ways to start the debugger:
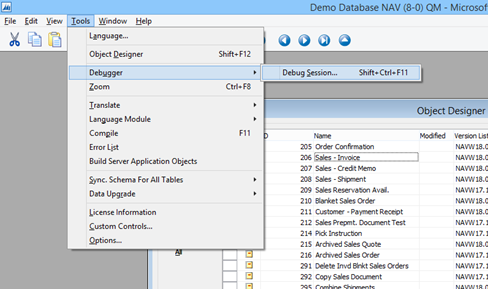
Start from Development Environment:
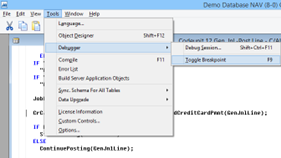
The menu item Tools/Debugger/Debug Session will bring up a list of the active instances/sessions available to debug. It will only show instances/sessions connected to the database that has been opened in the develop environment.
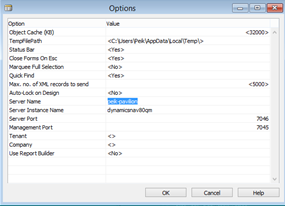
It is possible to “Hard Code” which instance the development environment is connected to by going to Tools/Options and type in a different server/instance name:
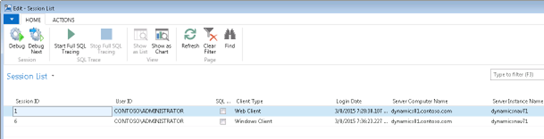
The session list will show all the different sessions and client types currently connected to the instance.
Start from the RoleTailored Client:
In the RoleTailored Client, first it is necessary to connect to the instance that needs debugging. Once in, go to the Sessions menu item located at Departments/Administration/IT Administration/General/Sessions (or cheat by pressing Ctrl+F3 and type sessions).
Start from the Run command:
Lastly, it is possible to start from the run command:
dynamicsnav://<servername>/<session>/<company>/runpage?page=9506
Notice that it is not possible execute the command from the search field in Windows 7, it must be the Run command.
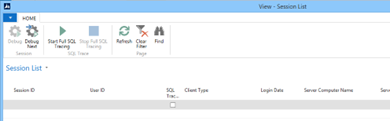
The sessions list
From the sessions list it is possible to activate the debugger depending on what to debug:
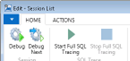
Debug:
An error is occurring in the selected session, which by the way could be operated by another user.
Or
A breakpoint has been set in the code in the development environment or previously in the debugger, and the debugger will stop on the breakpoint. There are also other breakpoint options but starting up it is only possible to set the breakpoint in the code in the development environment.
Debug Next:
Stop on the first error/breakpoint in ANY of the active sessions. This is a little bit dangerous since any error made by any unsuspecting user will trigger the debugger, and for the user the session will “hang” all of a sudden while you take over their session. Later we will go through some of the uses of the Debug Next function.
Start Full SQL Tracing:
This is used when tracing the performance in the SQL profiler. This can be a topic of another blog post.
Setting the breakpoint in the Development Environment
From the Development Environment it is possible to set the breakpoint in the code somewhere. This however is only possible if the license includes Solution Developer. Just go to the object that needs debugging, find a place in the code and set a breakpoint by pressing F9. There is also a menu item Tools/Debugging/Toggle Breakpoint
First time the F9 is pressed a Red dot will appear next to the line:
Pressing twice the mark remains as an inactive breakpoint just to keep track of where the breakpoint used to be, but the debugger will not stop here.
How to activate the debugger if the license does not include Solution Developer
It is still possible to activate the debugger without license for Solution Developer. It is just a little more complicated. When the debugger is activated, the debug page is shown, however no breakpoint has been set and the debugger will therefore not be triggered unless an error occurs. If however, the Break button is pushed right after the debugger is activated, the debugger will stop at the next code that is executed.
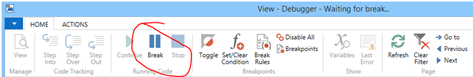
This is also the way to stop the code in the middle of a user action. For example when the warning for exceeded credit limit and overdue payments is shown:
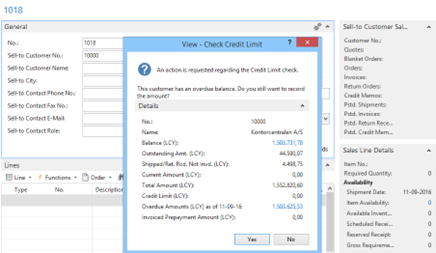
Click the Break and click Yes in the warning – and “Got You”:
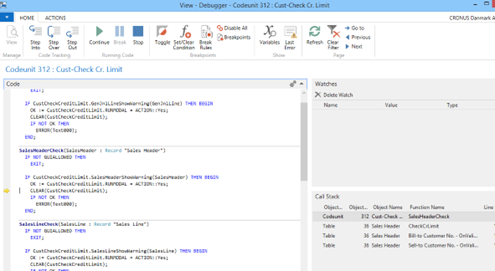
Now the debugger has stopped right after the Credit limit warning.
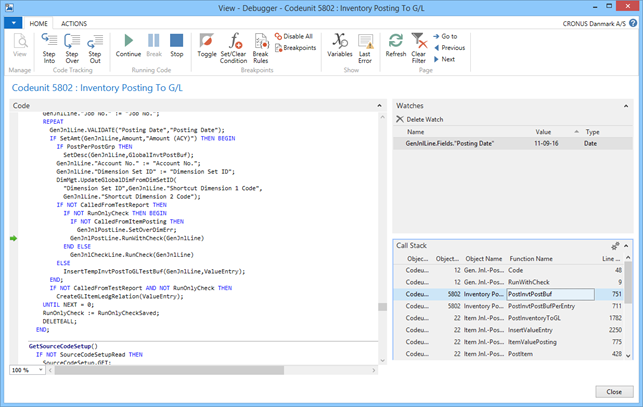
The Debugging Window
The debugging window looks more or less like the old one:
The page consists of three sections:
- The Code page
- The Watch FactBox
- And the Call Stack FactBox
In the code page, it is possible to see the code around the breakpoint and to see the actual position of the cursor. The new stuff is that it is possible to see the value of the variables just by hovering the mouse over the variable:
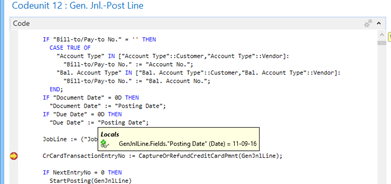
If there are more than one instance if the variable or if exists in different scopes, all instances will be shown.
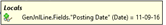
The little + and the glasses enables you to add the variable to the Watch List FactBox. After clicking the glasses the variable appear in the Watch List until it is removed again. If something else is debugged, it will be shown as out-of-scope.
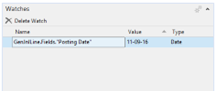
Now the value of Posting Date is visible to me throughout the debug session.
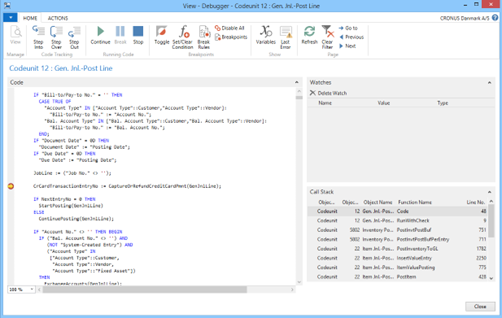
The Call Stack FactBox shows the path which the system has followed to end up at the breakpoint.
Clicking one of the lines below will show the function that the system executed to get to the present position. The Green arrow in the code page indicates that the position is not the actual one. Combined with a third window, the variables, it is possible to see the state and values of all variables, at the time of entering the function.
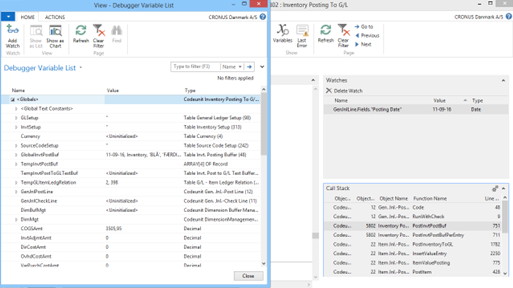
A second place to add a variable to the Watch List is by clicking the variable in the Variable window and then the Glasses in the upper left corner.
Conditional breakpoints
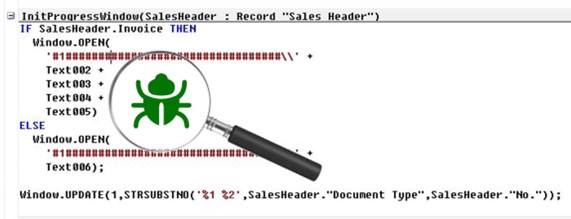
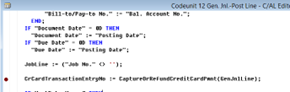
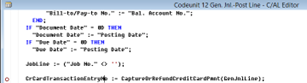
A new functionality is the conditional breakpoint. In the “Old Days” a little code snippet was inserted in the code:
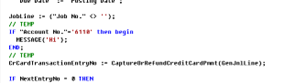
Then the breakpoint would be set on the MESSAGE(‘Hi’) line;
This is no longer necessary.
The conditional breakpoint can be created like an ordinary breakpoint. It will be shown as a breakpoint with a + inside:
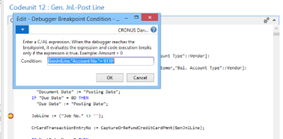
Most simple datatypes can be created as conditional breakpoints. Exceptions are date, time and datetime fields. The only thing is, that the conditional breakpoint can only be set in the debugger window. Therefore, a normal breakpoint is usually first set to activate the debugger, then the conditional breakpoint can be set to replace the normal breakpoint.
Disable All Breakpoints
It is easy to get carried away setting lots of breakpoints in many different levels. Therefore, it is also good to be able to remove some or all breakpoints. The function Disable All will disable all breakpoints including conditional breakpoints. The disabled breakpoint can be enabled again by pressing F9 on the breakpoint.
Another function is the Breakpoints function, which will open a new window with a list of all breakpoints:
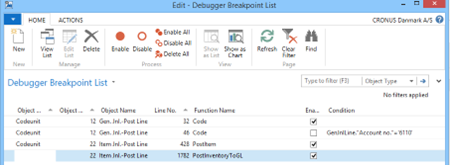
Here the state of each breakpoint can be seen and it can be enabled, disabled or deleted.
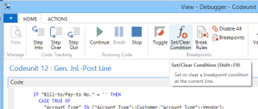
Break Rules
In the Break Rules window a number of great new properties appear:
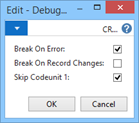
If the debugger should not stop on errors, the check mark can be removed here. Now the debugger will only stop if a breakpoint has been set.
A check mark in the Break On Record Changes field will cause the debugger to stop first time a record changes.
Lastly, the debugger has been defaulted to skip all code in codeunit 1. This is to prevent the problems in previous version with the circular debugging due to the caption class functionality. If the debugging should include codeunit 1, the check mark must be removed here.
Starting/Stepping/Stopping the execution of the code
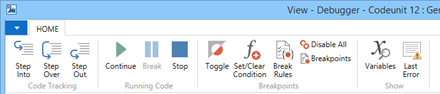
The functions to control the debugger are almost the same as in previous versions but with a number of welcomed additions:
Step Into (F11)
Execute the next line of code. If the line includes one or more functions then the debugger will step into the function showing and debugging the code in the function.
If there are more than one function in the line, the functions will be executed according to the precedence rules.
Step Over (F10)
Execute the next line of code. If the line includes one or more functions then the debugger will execute the code in the function like normal but remain on the line.
Steep Out (Shift+F11)
If the debugger stepped into the function by mistake or it is decided that there are no code in the function relevant to the problem that is being debugged, the Step Out button will execute the remaining code in the function like normal and then return to the line that originally called the function.
Continue
This will quit the debug session and execute the remaining code like normal. All breakpoints will remain and the debugger window will remain open ready for the next debugging.
Break
No matter where the cursor is, the debugger will stop at the next line of code that is being executed.
Stop
Quit the debug session and fire an error and full roll back. All breakpoints will remain and the debugger window will remain open ready for the next debugging. This is particularly important, if the test scenario is difficult to recreate e.g. first time postings are made to a new item. By stopping the debugger, the test data will remain intact for future debugging.
Show Last Error
Will show the error that triggered the debugger.
Debugging Web services
Debugging Web services is a little trickier because of the relatively short time the web service session exists. When the session only exists in a few seconds, it is not possible to click debug on the session in the Sessions window. In this case, a separate instance only for web services and the run command will come in handy:
dynamicsnav://localhost/Webservice80/CRONUS Danmark A/S/runpage?page=9506
Now the session window will start up empty:
Now press Debug Next, and the debugging window will start up as normal. Next, it is possible to either press Break or wait for the debugger to break on a breakpoint previously set in the code the web service is supposed to execute. If the web services instance is the same as the instance for the NAS and the Windows Client, it is not recommended to press Break since any code executed by any client will trigger the debugger. In that case, a breakpoint in the web service code is the only option. It is also recommendable to disable break on errors, since any error made by any client will also trigger the debugger.
The best solution though, is to create a separate instance only for web services.
Debugging NAS services
In previous versions, it was a little difficult to debug the NAS. In the versions from 2013 and forward, all it takes is to log on to the NAS service instance with the Windows Client (or to run the Services window with the NAS instance name like described previously), start the debugger and use the same procedure as described above.