Creating the base app
Since the base application is no longer available through C/Side, we must find other ways to access the source code of the base application for searching and debugging.
The cool part is that you already have access to it and let me demonstrate how you can create your own base application I a few steps.
First create a new AL project in Visual Studio Code:
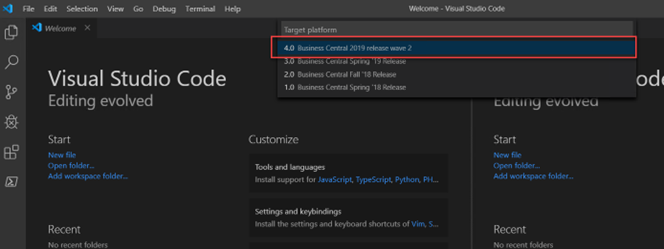
Select the runtime that corresponds with the solution you need access to.
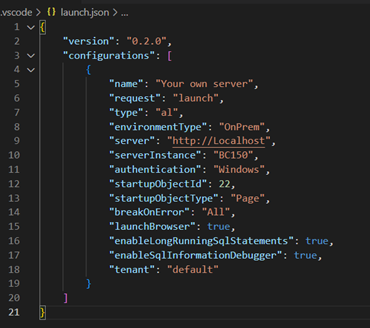
Complete the settings in the launch.json file to connect to the solution.
Then download the symbols. This will create a new folder named: .alpackages
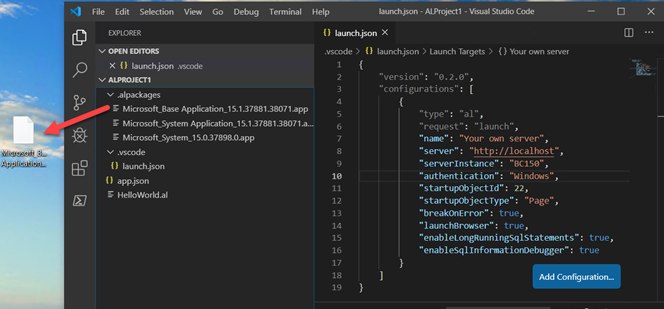
Open the folder and drag the Microsoft_Base_Application file to a new folder. I usually create a folder in the AL folder and name it _BaseApp 15.1 if the version is 15.1.
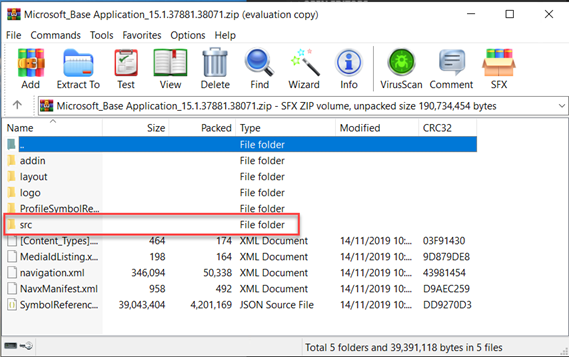
Then rename the .app extension to .zip. All app-files are actually archives and can be opened.
You can only open the file with Winrar and you can buy your own version from here.
The archive looks like this:
Searching the base app
You can extract the content to your folder and then open it with Visual Studio Code:
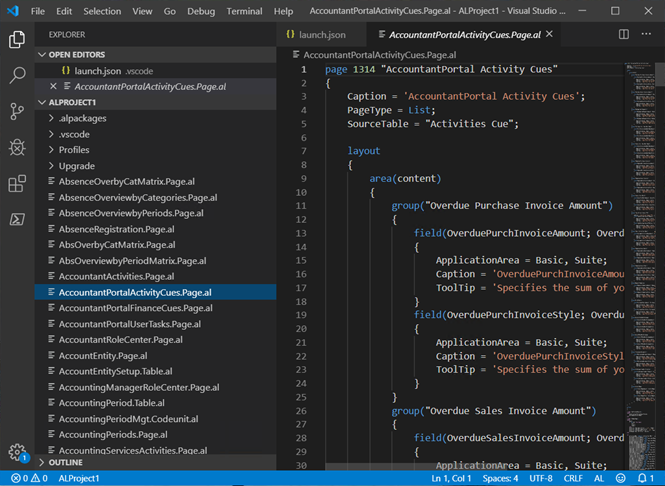
As it appears, Microsoft have changed the naming convention of the files, so they have the format:
<Object Name>.<Object Type>.al
That also means that now it is no longer possible to read the object numbers from the file name, which can make it challenging to find the next vacant number. Ctrl+Space will help in some environments by suggesting the next object number when creating a new object, but it does not work in all environments.
So, how do we search for files in the base application?
The answer is Ctrl+P in Visual Studio Code, which will open a search bar that works like the search in the client. If I need the sales order pages, it is enough to search for sal or pa or in this case the salesheader.tab for the sales header table.
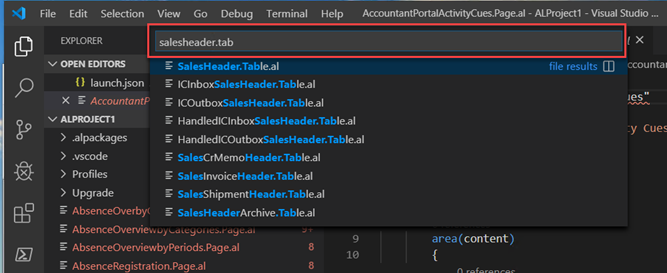
Selecting the file will open the object.
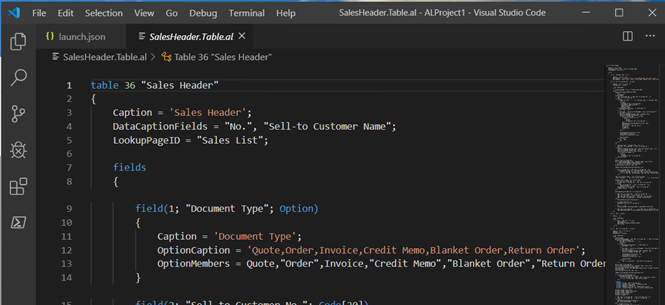
It is not possible to use the Go to Definition function but the search is there for a reason
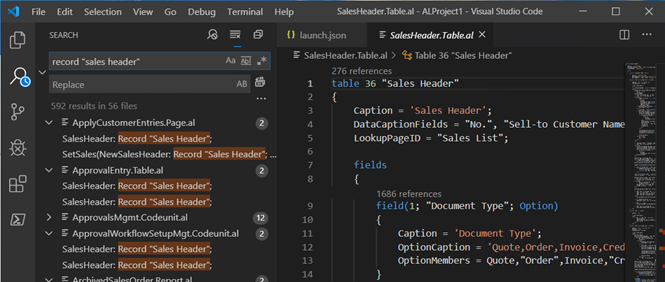
One of the most awesome functions in the Visual Studio Code is the ability to search or even replace across all objects in the project. In the base app, it is the search function that gives value. Below a search is made for record “sales header” which will show all places where the sales header is declared as a variable.
Debugging the base app
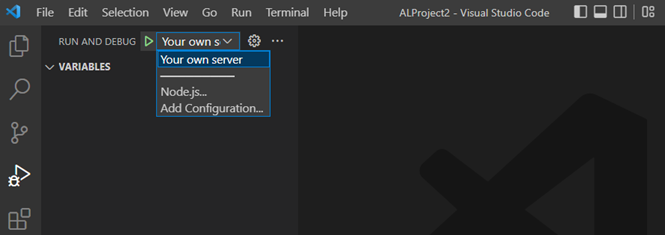
In order to debug the base app, it is first necessary to connect the base-app to the service tier. This can be done from the run and debug icon:


In future versions the icon has changes and now looks like this

Click the Add configuration and the following option shows up:
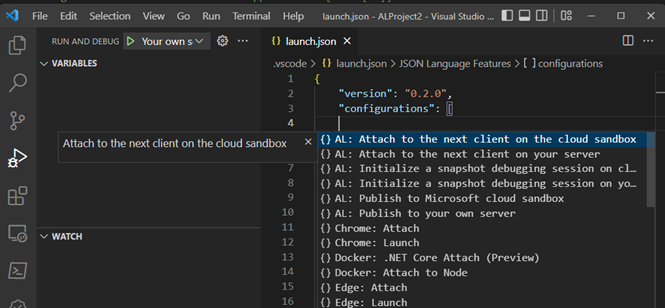
Here attach to the servicetier.
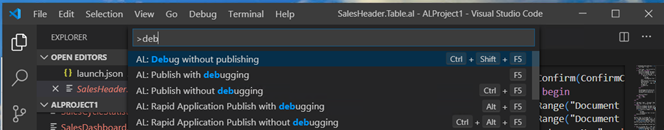
Then DO NOT download symbol, instead, use Ctrl+P and select Debug without publishing.
Set a break point somewhere in the code.
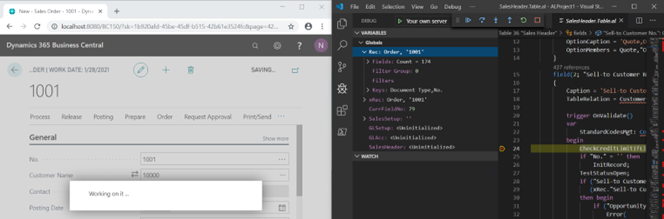
And start debugging.
In the run and debug section all the usual tools are available:
- Global variables
- Local variables
- Watches
- Call Stack
Happy debugging